
Johnson & Johnson (JNJ)
Health Care47 articles
Price chart
Why is JNJ moving today?
-0.7%JNJ is -0.7% today, inside the ordinary range for a session (under 3%). No stories about it reached the feed in the last 24 hours.
What this does not prove. A story on the same day is evidence of timing, not of cause: it explains a move only if it accounts for the size and the direction, and most single-stock moves carry a sector or index component too. Nothing here is a forecast.
Source: Yahoo Finance - quote as of 58 minutes ago
Johnson & Johnson (JNJ) overview
Johnson & Johnson is a healthcare giant spanning pharmaceuticals and medical devices, known for its deep drug pipeline.
JNJ is a member of the S&P 500. It sits in the Health Care sector. That sector covers pharmaceutical, biotech, device and managed-care companies.
Johnson & Johnson trades on the NYSE under the ticker symbol JNJ. The most recent market data puts the share price at about $253.79. That is down 0.69% on the session. At that price the company is worth roughly $611.61B.
Over the past 52 weeks, JNJ has traded between $184.66 and $281.07. Shares change hands at a trailing price-to-earnings (P/E) ratio of about 38.5. The P/E ratio sets the share price against a year of earnings. A higher number means the market is paying more for each dollar the company earns. JNJ also pays a dividend. It yields around 2.10% at the current price.
Key statistics
Source: Yahoo Finance - quote as of 58 minutes ago
Informational only, not financial advice. Content is AI-generated and may contain errors. How this works.
Why investors watch JNJ
JNJ is one of the larger names in the Health Care sector, so investors follow it closely. It tends to move with the rest of the sector. This page sums up each JNJ story as it breaks, and tags it bullish, bearish or neutral.
Size matters here as well. The S&P 500 is weighted by market value. JNJ is large enough that its own share price nudges the whole index. So it is worth watching even for investors who only hold index funds.
What moves JNJ
- Earnings. JNJ reports results four times a year. A surprise against the estimate tends to move the stock that day.
- Analyst calls. Upgrades, downgrades and new price targets change what the market expects from JNJ.
- Sector news. Health Care stocks often move together, so a rival's news can move JNJ too.
- Index weight. JNJ is big enough to move the S&P 500 on its own.
Market Mood
This week for JNJ
1 story about Johnson & Johnson in the last 7 days- J&J (JNJ) Reports Earnings Beat, Plans 2027 SpinoffEarningsneutralcnbc.com
Follow JNJ without checking every day
One email every Monday with the week's biggest moves and the stories behind them. Free, unsubscribe anytime.
Latest JNJ news

J&J (JNJ) Reports Earnings Beat, Plans 2027 Spinoff
Johnson & Johnson (JNJ) reported earnings that surpassed analyst expectations, driven by strong sales of its immune disease drug, Tremfya. The company also announced plans to spin off its hips-and-knees business, DePuy Synthes, into a standalone company by mid-2027. J&J sees a spin as creating long-term value for shareholders. Apollo Global Management is currently in talks to acquire the unit for an estimated $20 billion, according to Bloomberg. Revenue from J&J's medical technology division rose 2.5% to $8.6 billion, falling short of the $8.71 billion analysts anticipated. International sales remained flat, affected by factors including the Middle East conflict, European austerity measures, and pricing challenges in China. Despite external pressures, the company increased its full-year sales forecast to about $101.2 billion and adjusted its earnings forecast to a midpoint of $11.10 per share. The spin-off of DePuy Synthes reflects J&J's strategy to focus on higher-growth sectors within healthcare. This separation is likely to allow both companies to allocate resources more effectively, aiming for enhanced performance in their respective markets. For investors, the planned spin-off and raised forecasts indicate J&J's commitment to sustained growth.
Read More: J&J (JNJ) Reports Earnings Beat, Plans 2027 Spinoff
Bank and Chipmaker Earnings Set to Shape Markets Next Week
The upcoming week will see the commencement of earnings season with major banks and semiconductor companies reporting their results. Key financial institutions like Goldman Sachs, Wells Fargo, JPMorgan Chase, and Citigroup will report on Tuesday. Jim Cramer notes recent weakness in bank stocks, which might rally if they surpass expectations. Additionally, Johnson & Johnson will release its earnings, often seeing a stock sell-off despite strong results. The release of consumer price index data on Wednesday will provide signals on inflation trends. Semiconductor company ASML will also report, with potential guidance updates impacting related stocks such as Lam Research and Applied Materials. On Thursday, chipmaker Taiwan Semiconductor Manufacturing’s earnings could significantly affect tech sector valuations. Economic indicators like the producer price index and retail sales data will further inform on inflation and consumer spending. This earnings season is critical for investors to gauge corporate performance amid economic pressures like rising bond yields and oil prices. The results could potentially drive significant stock movements, particularly in the banking and technology sectors.
Read More: Bank and Chipmaker Earnings Set to Shape Markets Next Week
Johnson & Johnson's Competitive Edge Over Medtronic in History
The article discusses historical performance trends, indicating that Johnson & Johnson (JNJ) has historically outperformed Medtronic (MDT). However, the analysis suggests considering Medtronic for long-term potential. This performance comparison includes various market factors affecting both companies. Overall, investors might evaluate Medtronic's future alongside its historical context when making investment decisions.
Read More: Johnson & Johnson's Competitive Edge Over Medtronic in History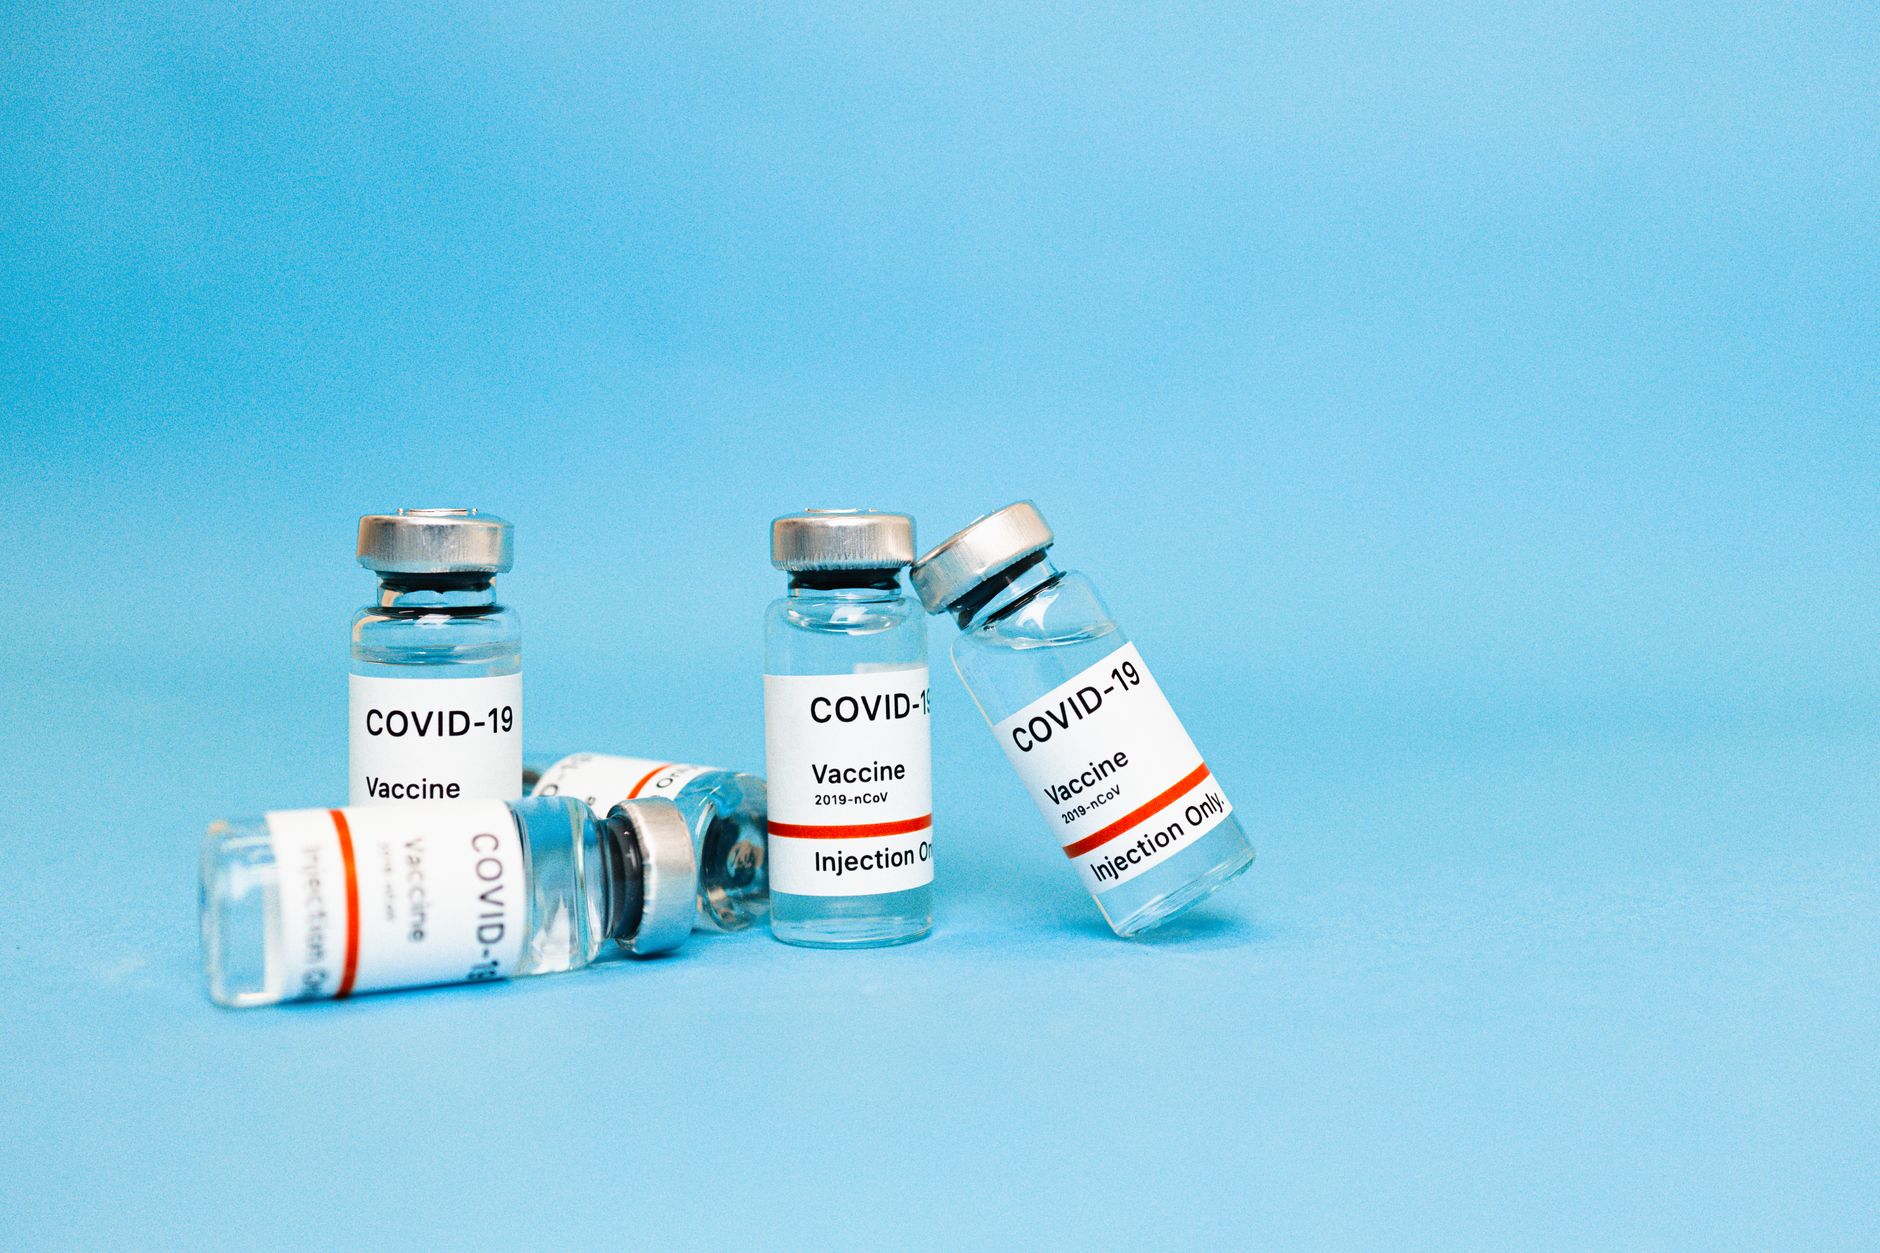
Johnson & Johnson (JNJ) May Offload Orthopedics Unit for $20 Billion
Johnson & Johnson (JNJ) is considering selling its orthopedics unit for approximately $20 billion. This potential divestiture could indicate a shift in J&J's focus towards its core operations and might enhance shareholder value. The company is exploring various options and has not finalized any decision yet. The sale is notable as it reflects strategic moves within the healthcare sector, which may influence market valuations. Investors should pay attention to how this potential sale could impact J&J's revenue and operational focus moving forward.
Read More: Johnson & Johnson (JNJ) May Offload Orthopedics Unit for $20 Billion
Intel (INTC) and Micron (MU) Boost Portfolio Performance
Intel (INTC) and Micron (MU) have contributed positively to the performance of an investment portfolio, suggesting a strong case for retaining these assets. The mention of Johnson & Johnson (JNJ) further supports the argument for portfolio ownership. Specific figures regarding performance or changes in stock prices were not provided in the article. This aligns with the broader market trends that investors need to consider when evaluating tech investments.
Read More: Intel (INTC) and Micron (MU) Boost Portfolio Performance
J&J (JNJ) Talks to Sell Hips-and-Knees Business for $20 Billion
Johnson & Johnson (JNJ) is in discussions to sell its hips-and-knees business to Apollo Global Management for approximately $20 billion. This potential divestiture is part of J&J's strategy to focus on core businesses and improve operational efficiency. If finalized, this deal could impact J&J's financial position and possibly affect its stock price. The move signals a significant shift in the company’s strategy, which is vital information for investors considering the financial health and direction of J&J.
Read More: J&J (JNJ) Talks to Sell Hips-and-Knees Business for $20 Billion
Apollo Global (APO) in Talks for J&J Orthopedics Unit Acquisition
Apollo Global Management (APO) is reportedly in discussions to acquire Johnson & Johnson's orthopedics unit. The potential deal is significant given J&J's recent divestitures, indicating the company's strategy to streamline operations. The acquisition aligns with Apollo's focus on expanding its healthcare portfolio. If successful, this transaction could enhance Apollo's market position and affect stock performance in both companies. Monitoring these developments is essential for investors, as strategic acquisitions can lead to changes in stock prices.
Read More: Apollo Global (APO) in Talks for J&J Orthopedics Unit Acquisition
Johnson & Johnson (JNJ) Receives CE Mark for New Contact Lens
Johnson & Johnson (JNJ) has received the CE mark for its new contact lenses that are designed to be worn for two weeks. This regulatory approval allows the company to market the product in European countries. The CE mark is a significant milestone as it indicates compliance with safety, health, and environmental protection standards within the European Economic Area. The introduction of new products like these can enhance JNJ's portfolio and potentially boost revenues from the contact lens segment.
Read More: Johnson & Johnson (JNJ) Receives CE Mark for New Contact Lens
J&J (JNJ) Continues Climb as Key Drivers Support Record Highs
Johnson & Johnson (JNJ) is approaching record highs, driven by solid performance in its pharmaceuticals and medical devices segments. The company's recent strategies and innovations are bolstering growth prospects, although specific financial data points were not detailed in the article. This ongoing upward trend reflects positive investor sentiment and could suggest increased market confidence in J&J's future earnings potential. Investors should monitor J&J for further developments that could influence its stock performance.
Read More: J&J (JNJ) Continues Climb as Key Drivers Support Record Highs
Johnson & Johnson (JNJ) Named Top Dividend Stock to Buy Now
Johnson & Johnson (JNJ) has been highlighted as a strong dividend stock option. No specific dividend yield or payout ratio is mentioned in the article. The endorsement of JNJ as a top choice reflects the company's stability in profits and dividends in the current market. Identifying strong dividend stocks is essential for investors looking for income in fluctuating markets.
Read More: Johnson & Johnson (JNJ) Named Top Dividend Stock to Buy NowJohnson & Johnson Signals Strong Dividend Stock Potential
Johnson & Johnson has been highlighted as an ideal dividend stock for current investors, emphasizing its consistent dividend payments. The company is known for its stable earnings and has a strong history of annual dividend increases, making it attractive for income-focused investors. This situation matters for markets as dividend stocks are often sought during uncertain economic times, potentially boosting stock demand. Investors seeking reliable income may find Johnson & Johnson (JNJ) particularly appealing, which could influence stock performance positively.
Read More: Johnson & Johnson Signals Strong Dividend Stock Potential
Johnson & Johnson (JNJ) Dividend Growth Strategy for $79,200 Income
To generate $79,200 annually in dividend income, capital requirements vary based on yield. For conservative dividend growers, approximately $2.26 million is needed, while high-yield BDCs require around $660,000. Johnson & Johnson (JNJ) currently yields about 2.0% and has increased its quarterly payout to $1.34, marking 64 years of consecutive dividend increases. In contrast, dividends that remain flat can stagnate and may risk erosion if the principal declines. Understanding these thresholds is essential for pre-retirees planning their retirement income strategies.
Read More: Johnson & Johnson (JNJ) Dividend Growth Strategy for $79,200 IncomeJohnson & Johnson (JNJ) EVP sells $3.95 million in stock
Jennifer Taubert, Executive Vice President of Johnson & Johnson (JNJ), sold $3.95 million worth of company shares. This transaction may raise concerns among investors about insider sentiment regarding the company's future performance. Insider sales can sometimes signal a lack of confidence in stock prospects, leading to potential market impact. It is important for investors to monitor such activities as they can influence stock price and market perception.
Read More: Johnson & Johnson (JNJ) EVP sells $3.95 million in stock
J&J CEO Duato sells $12.5M in company stock
J&J CEO Joaquin Duato sold $12.5 million worth of Johnson & Johnson (JNJ) stock. This transaction involved approximately 140,000 shares at an average price of about $89.14 per share. The sale represents a significant divestiture and has raised questions regarding executive confidence in the company's future. Such large insider sales can influence market perceptions and investor sentiment, potentially affecting Johnson & Johnson's stock price in the near term.
Read More: J&J CEO Duato sells $12.5M in company stock
State Street Healthcare ETFs XLV and XBI: Cost, Performance Comparison
The State Street Health Care Select Sector SPDR ETF (XLV) has an expense ratio of 0.08% and a dividend yield of 1.6%, with a recent share price of approximately $163.52. In contrast, the State Street SPDR S&P Biotech ETF (XBI) has an expense ratio of 0.35% and a dividend yield of 0.4%, priced around $151.46. XLV includes large-cap stocks such as Eli Lilly (NYSE:LLY) at 15.97% and Johnson & Johnson (NYSE:JNJ) at 10.67%. This comparison of cost and performance illustrates different investment strategies, affecting investor choices and asset allocations.
Read More: State Street Healthcare ETFs XLV and XBI: Cost, Performance Comparison
Johnson & Johnson (JNJ) Offers 2% Yield, Projects 8.2% Earnings Growth
Johnson & Johnson (JNJ) has a forward dividend yield of approximately 2% and has raised its quarterly cash payout for 65 years, averaging annual increases of 5.7% over the last decade. The company anticipates earnings growth of 8.2% in 2026 and 9.8% in 2027. Key drivers include a recently announced $5.5 billion settlement regarding talc product liabilities and a 73% sales growth in its Tremfya psoriasis treatment, generating $2 billion in revenue. This projected earnings growth supports potential for further dividend increases, making JNJ attractive for dividend-focused investors.
Read More: Johnson & Johnson (JNJ) Offers 2% Yield, Projects 8.2% Earnings Growth
XLV vs PBE: Comparing Two Healthcare ETFs for Investors
The State Street Health Care Select Sector SPDR ETF (XLV) has an expense ratio of 0.08% and offers a yield of 1.6%, while the Invesco Biotechnology & Genome ETF (PBE) has a 0.58% expense ratio and a yield of 1.7%. XLV includes 60 holdings like Eli Lilly & Co (NYSE:LLY) at 16.5% and Johnson & Johnson (NYSE:JNJ) at 10.6%. In contrast, PBE holds 30 companies, with Vertex Pharmaceuticals (NASDAQ:VRTX) at 5.2% and Biogen Inc (NASDAQ:BIIB) at 5.1%. This comparison helps investors weigh low-cost sector exposure versus targeted growth potential in biotechnology.
Read More: XLV vs PBE: Comparing Two Healthcare ETFs for Investors
Coca-Cola (KO) and Johnson & Johnson Big Premarket Moves
Coca-Cola (KO) and Johnson & Johnson (JNJ) were highlighted for significant movements in premarket trading, reflecting investor reactions to their latest earnings reports. Sherwin-Williams (SHW) also made headlines, showing notable performance. Market shifts can impact overall investor sentiment and stock prices during regular trading hours. These premarket shifts provide insight into how major companies are performing and how investors may respond once the market opens.
Read More: Coca-Cola (KO) and Johnson & Johnson Big Premarket Moves
Johnson & Johnson (JNJ) Settles Talc Lawsuits for $5.5 Billion
Johnson & Johnson (JNJ) has agreed to pay $5.5 billion to settle lawsuits related to cancer claims tied to its talcum powder products. This settlement aims to resolve thousands of lawsuits alleging that the product caused cancer. The decision to settle comes as the company seeks to avoid prolonged litigation. This matters for investors as it reflects J&J's efforts to manage liabilities and could stabilize future earnings by reducing legal risk.
Read More: Johnson & Johnson (JNJ) Settles Talc Lawsuits for $5.5 Billion
Realty Income (O) Offers 5.11% Yield With 670 Consecutive Dividends
Realty Income (O) has a yield of 5.11% and has paid 670 consecutive monthly dividends, providing a reliable income source for retirees. The current quarterly dividend is $0.271 per share, and the company has raised its 2026 AFFO guidance to between $4.41 and $4.44. With a portfolio occupancy of 98.9% and management forecasting $9.5 billion in investments for 2026, Realty Income continues to appeal to income investors. This matters for ordinary investors as it highlights the potential of blue-chip dividend stocks as alternatives to traditional income sources like Social Security.
Read More: Realty Income (O) Offers 5.11% Yield With 670 Consecutive Dividends
Social Security at 62 Reduces Benefits by 30%; Dividend Strategies Impact Wealth
Delaying Social Security benefits from age 62 to 70 can increase monthly payouts by up to 48%. However, retirees need to replace approximately $30,000 per year in income during this period. To cover this gap, capital requirements range from $857,000 at a 3.5% yield to $300,000 at a 10% yield. Dividend growth portfolios featuring companies like Johnson & Johnson (JNJ), Procter & Gamble (PG), and Coca-Cola (KO) often result in greater wealth at age 75 compared to high-yield strategies that deplete principal. This analysis is relevant as it may influence retirement planning and investment strategies.
Read More: Social Security at 62 Reduces Benefits by 30%; Dividend Strategies Impact Wealth
J&J Stock Falls Despite Strong Q2 Results and Higher 2026 Outlook
Johnson & Johnson (JNJ) reported strong Q2 results but saw a decline in stock price. The company raised its revenue outlook for 2026, indicating expected growth. It is essential to monitor how such earnings announcements impact investor sentiment despite positive projections. This financial performance juxtaposed with stock price behavior highlights market volatility. Understanding these dynamics could help investors make informed decisions.
Read More: J&J Stock Falls Despite Strong Q2 Results and Higher 2026 Outlook
J&J Reports Strong Quarter, Price Target Raised Despite Stock Decline
Johnson & Johnson (JNJ) reported better-than-expected earnings and increased its guidance for the year. However, the stock fell despite this positive news. Analysts have raised their price targets based on the strong performance, indicating confidence in the company's future despite market reactions. The fluctuations highlight the complexities investors navigate in evaluating company performance against stock market responses.
Read More: J&J Reports Strong Quarter, Price Target Raised Despite Stock Decline
3 Stocks to Hold: Focus on AAPL, MSFT, and JNJ
The article identifies three stocks to consider holding through varying market conditions: Apple (AAPL), Microsoft (MSFT), and Johnson & Johnson (JNJ). It emphasizes Apple's strong brand loyalty and innovation, while Microsoft boasts significant growth in cloud services. Johnson & Johnson is noted for its diversified portfolio and stability. By focusing on these companies, investors might mitigate risks and capitalize on reliable growth opportunities during market fluctuations.
Read More: 3 Stocks to Hold: Focus on AAPL, MSFT, and JNJ
Cramer Sees Opportunities: Buy JNJ, PEP, SBUX, STZ, TJX Stocks
Jim Cramer highlighted buying opportunities in five stocks due to a recent market rotation. The June jobs report indicated a slowdown, leading institutions to reposition portfolios. Cramer mentioned PepsiCo (PEP) as a potential bargain ahead of its July 9 earnings report and noted Starbucks (SBUX) as a good buy amidst its turnaround efforts. Additionally, he expressed bullishness on TJX Companies (TJX), given the trend of consumers trading down to off-price retailers. Understanding these dynamics can benefit ordinary investors looking for discounted quality stocks.
Read More: Cramer Sees Opportunities: Buy JNJ, PEP, SBUX, STZ, TJX Stocks
Johnson & Johnson (JNJ) Positioned for Earnings Report
Johnson & Johnson (JNJ) has been identified as the IBD Stock of the Day, indicating strong market interest as it approaches its earnings report. The company is currently in a buy zone, suggesting favorable trading conditions. As the earnings release date approaches, analysts are closely monitoring trading volumes and price movements to gauge investor sentiment. This positioning may lead to increased activity around the upcoming earnings call.
Read More: Johnson & Johnson (JNJ) Positioned for Earnings Report
IHE vs PJP: Key ETF Metrics Include Expense Ratios and Dividends
The iShares U.S. Pharmaceuticals ETF (IHE) has an expense ratio of 0.38% and a dividend yield of 1.62%, while the Invesco Pharmaceuticals ETF (PJP) has a higher expense ratio of 0.57% and a dividend yield of 0.96%. IHE holds 56 positions, heavily concentrated in Eli Lilly (NYSE:LLY) at 24.2% and Johnson & Johnson (NYSE:JNJ) at 20.3%. In contrast, PJP features 29 companies with Eli Lilly at 5.4%. Investors' choice between IHE and PJP hinges on their comfort with company-specific risks within the pharmaceutical sector.
Read More: IHE vs PJP: Key ETF Metrics Include Expense Ratios and Dividends
PEP and JNJ Dividends Required for California's $100,600 Income
To replace California's median household income of $100,600, an investment of approximately $2,874,000 is needed at a 3.5% yield or $1,212,000 at 8.3%. California's living costs are about 10.7% above the national average, pushing investors to consider dividend stocks like PepsiCo (PEP) and Johnson & Johnson (JNJ). PEP offers a current yield of about 4% and raised its quarterly dividend to $1.48, while JNJ's yield is approximately 2% with a quarterly dividend of $1.34. This data highlights the importance of considering dividends for income growth amidst rising costs in California.
Read More: PEP and JNJ Dividends Required for California's $100,600 Income
Portfolio Needs $400K to Replace $40K Income at 10% Yield
To replace $40,000 in lost income, a portfolio needs between $400,000 (10% yield) and $1.14 million (3.5% yield) in dividend-generating assets. A 3.5% dividend-growth portfolio can produce approximately $154,000 annually by year 20. The impact of going part-time may add $8,000 to $15,000 to the income replacement target due to lost employer health coverage and 401(k) matching. Financial professionals vary in their motivations, emphasizing the importance of finding a fiduciary adviser.
Read More: Portfolio Needs $400K to Replace $40K Income at 10% Yield
BMY vs JNJ: Healthcare Revenue Comparison for 2025
In fiscal 2025, Bristol Myers Squibb (BMY) reported revenue of nearly $48.2 billion, a decrease of approximately 0.2% from the previous year, with a net income of roughly $7.1 billion and a net margin of 14.6%. In contrast, Johnson & Johnson (JNJ) achieved approximately $94.2 billion in revenue, reflecting an increase of nearly 6% year-over-year, accompanied by a net income of around $26.8 billion and a net margin of 28.5%. BMY's balance sheet showed a debt-to-equity ratio of 2.6 and a current ratio of 1.3, while its free cash flow reached nearly $12.8 billion. These figures underscore the differing financial health and revenue growth trajectories of these two healthcare companies.
Read More: BMY vs JNJ: Healthcare Revenue Comparison for 2025
BMY and JNJ Financials: 2025 Revenue Numbers Declared
For FY 2025, Bristol Myers Squibb (BMY) reported revenue of approximately $48.2 billion, reflecting a slight decline of 0.2% year-over-year, while net income was $7.1 billion, yielding a net margin of 14.6%. In contrast, Johnson & Johnson (JNJ) achieved revenue of about $94.2 billion, marking a 6.0% increase, with a net income of nearly $26.8 billion and a net margin of 28.5%. BMY's debt-to-equity ratio stood at 2.6x, while JNJ's was 0.6x, indicating differing financial leverage. Their performance could influence investor strategies given the contrasting growth potential and stability they provide.
Read More: BMY and JNJ Financials: 2025 Revenue Numbers Declared
PFE and JNJ Annual Dividend Income of $3,540 for Investors
Investors holding 500 shares each of Pfizer (PFE) and Johnson & Johnson (JNJ) can expect an annual passive income of $3,540 on a $127,000 investment, with a blended yield of 2.79%. JNJ recently increased its quarterly dividend to $1.34, marking its 64th consecutive increase, supported by a AAA-rated balance sheet and $19.7 billion in free cash flow. Meanwhile, PFE's yield stands at 6.8%, reflecting stock compression. JNJ reported Q1 2026 revenues of $15.426 billion in pharmaceuticals, an 11.2% year-over-year increase, while MedTech revenue reached $8.636 billion, up 7.7%.
Read More: PFE and JNJ Annual Dividend Income of $3,540 for Investors
Johnson & Johnson (JNJ) Shares Up 53% in Past Year
Johnson & Johnson (JNJ) shares have gained 53% over the past year and are up 15% year-to-date. Leerink Partners upgraded JNJ's shares on May 13th, raising the price target from $252 to $265. The firm believes that JNJ's new drugs will contribute to revenue growth and share price performance. Additionally, JNJ has seen a 7.7% increase in share price over the past month amid market liquidity issues.
Read More: Johnson & Johnson (JNJ) Shares Up 53% in Past Year
J&J (JNJ) Expands US Rollout of TECNIS Cataract Lens
Johnson & Johnson (JNJ) has announced the expansion of its TECNIS PureSee cataract lens throughout the United States. This lens technology aims to improve vision for cataract patients and is expected to enhance J&J's offerings in the ophthalmic market. While precise financial figures were not disclosed, the expansion supports J&J’s strategic goals in healthcare innovation. This move could potentially impact market share positively for JNJ in the medical device sector, increasing competition in the ophthalmic field.
Read More: J&J (JNJ) Expands US Rollout of TECNIS Cataract Lens
Dividend Strategy Beats 4% Rule by Up to $430K Over 20 Years
A dividend strategy yielding 3.8% can outperform the 4% withdrawal rule by $430,000 over 20 years on a $1 million portfolio. Initially generating about $38,000 annually, this method does not necessitate selling shares. Underlying factors include a projected 7% annual growth in dividends, potentially reaching $147,000 by year 20. Market dynamics show that while S&P 500 dividends fell only 8% during the 2008-09 crisis, share prices decreased by 57%, indicating the resilience of dividend income.
Read More: Dividend Strategy Beats 4% Rule by Up to $430K Over 20 Years
Dividend Portfolio Return: $43,770 Annual Income and $7,515 Tax Impact
A $1 million dividend portfolio generates approximately $43,770 annually, subjected to $7,515 in taxes at the 24% bracket. This portfolio includes holdings such as Realty Income (O), Schwab U.S. Dividend Equity ETF (SCHD), and Johnson & Johnson (JNJ). The taxable portion of income is divided into qualified and ordinary income, impacting the total tax liability. The advantage of using a Roth IRA allows the full income to remain untaxed, highlighting the significance of account placement for tax efficiency.
Read More: Dividend Portfolio Return: $43,770 Annual Income and $7,515 Tax Impact
IHE vs IXJ: 39.7% vs 10% 1-Year Returns in ETFs Comparison
The iShares U.S. Pharmaceuticals ETF (IHE) has posted a 1-year return of 39.70% as of May 20, 2026, while the iShares Global Healthcare ETF (IXJ) reported a return of 10.00%. Both funds have similar expense ratios, with IHE at 0.38% and IXJ at 0.40%. IHE's assets under management (AUM) stand at $883.6 million, compared to IXJ's $3.6 billion. Additionally, IHE has a higher dividend yield of 1.70% versus IXJ's 1.50%, indicating potential advantages for investors favoring domestic pharmaceutical exposure.
Read More: IHE vs IXJ: 39.7% vs 10% 1-Year Returns in ETFs Comparison
Dividend Portfolio Yield Impacts After Taxes for California Residents
A retiree in California with a $1 million dividend portfolio earning a 5% yield generates $50,000 in gross income. After federal and state taxes, the net income drops to approximately $38,300, compared to $42,500 in states with no income tax, highlighting a $4,200 annual after-tax gap. California taxes dividends as ordinary income, with state rates ranging from 9.3% to 13.3%. Key dividend stocks mentioned include Johnson & Johnson (JNJ) at a 2.2% yield and Procter & Gamble (PG) at 3.0%.
Read More: Dividend Portfolio Yield Impacts After Taxes for California Residents
Johnson & Johnson (JNJ) Q1 2026 Revenue Hits $24.06 Billion
Johnson & Johnson (JNJ) reported Q1 2026 revenue of $24.06 billion, representing a 9.9% year-over-year increase, driven by TREMFYA's growth of 68.3% and DARZALEX's increase of 22.5% to $3.96 billion. The company raised its full-year guidance to a midpoint of $100.8 billion. AbbVie (ABBV) also exceeded expectations with Q1 revenue of $15 billion and a year-over-year increase of 12.4%. AbbVie's Skyrizi reached $4.48 billion with a 30.9% increase, offsetting Humira's 38.6% decline.
Read More: Johnson & Johnson (JNJ) Q1 2026 Revenue Hits $24.06 Billion
Berkshire's Dividend Stock Picks: JNJ, MCD, PG for Market Downturn
Warren Buffett's Berkshire Hathaway held nearly $375 billion in cash at the end of 2025, indicating potential readiness for market downturn investments. The article identifies Johnson & Johnson (JNJ), McDonald's (MCD), and Procter & Gamble (PG) as favorable dividend stock picks in such a scenario. JNJ currently trades at about 19 times forward earnings but could become more attractive with a 20% to 25% pullback, yielding a dividend of 2.5% to nearly 3%. The dividends and consistent earnings growth of these companies highlight their stability during economic uncertainty.
Read More: Berkshire's Dividend Stock Picks: JNJ, MCD, PG for Market Downturn
Johnson & Johnson (JNJ) Launches Shockwave C2 Catheter for Coronary Procedures
Johnson & Johnson (JNJ) announced the launch of the Shockwave C2 Aero coronary catheter designed to treat coronary artery disease. This device aims to improve patient outcomes by facilitating easier and more effective treatments. The introduction of such innovative products could enhance JNJ's market position in the cardiovascular segment. As the demand for advanced medical technologies continues to grow, this launch may positively influence JNJ's market performance.
Read More: Johnson & Johnson (JNJ) Launches Shockwave C2 Catheter for Coronary Procedures
Dividend Portfolio Generates $17,500 Income from $500,000 Investment
A $500,000 portfolio yielding 3.5% can generate $17,500 annually, or about $1,460 per month, surpassing the federal minimum wage of $15,080 before taxes. For a 6% yield, the income increases to $30,000 annually, equating to $2,500 monthly, which also exceeds many state minimum wages. Notable investment options include Schwab U.S. Dividend Equity ETF (SCHD) and Realty Income (O), with established dividend increases. This analysis highlights the importance of yield versus compounding in portfolio growth over time.
Read More: Dividend Portfolio Generates $17,500 Income from $500,000 Investment
Bayer (BAYRY) Loses Bid Against Johnson & Johnson Prostate Drug Claims
A US judge rejected Bayer's (BAYRY) motion to block claims regarding Johnson & Johnson's (JNJ) prostate cancer drug. This ruling may affect Bayer's legal exposure related to similar product liabilities. The case underscores ongoing competitive pressures in the pharmaceutical sector, particularly regarding patent and claim disputes. Bayer's strategy and resource allocation may be impacted by this decision as they navigate the legal landscape.
Read More: Bayer (BAYRY) Loses Bid Against Johnson & Johnson Prostate Drug Claims
Johnson & Johnson (JNJ) Stock Target Increased After Earnings Report
Stifel has raised its price target for Johnson & Johnson (JNJ) following the company's latest earnings report. This upward adjustment reflects positive performance metrics, although specific earnings figures or percentage increases were not detailed. The revised target suggests analysts have confidence in JNJ's growth trajectory and profitability. As a result, the expectation of improved stock performance could influence investor sentiment and trading activity in JNJ shares.
Read More: Johnson & Johnson (JNJ) Stock Target Increased After Earnings Report
Johnson & Johnson (JNJ) Analyst Insights on Potential Price Drops
Limited data available — the article discusses Jim Cramer's perspective on Johnson & Johnson (JNJ), suggesting that if the stock experiences a significant decline, investors should consider buying. However, no specific price targets, trading volumes, or percentage changes are provided. The insights reflect market sentiment but lack concrete data that would impact decision-making or stock evaluation. As such, the article does not offer any verified facts or numbers relevant to JNJ's current financial standing.
Read More: Johnson & Johnson (JNJ) Analyst Insights on Potential Price Drops
J&J (JNJ) Q1 Revenue Surges 10% to $24.1B, Beats Analyst Estimates
Johnson & Johnson (JNJ) reported first-quarter revenue of $24.1 billion, a nearly 10% increase from the previous year, surpassing analyst estimates of $23.6 billion. Adjusted earnings were $2.70 per share, exceeding the consensus estimate of $2.66. Key drug sales included $4 billion for Darzalex and $1.6 billion for Tremfya, both outperforming projections, while Stelara sales fell 60% to $656 million. JNJ raised its full-year revenue forecast to a midpoint of approximately $100.8 billion, slightly above Wall Street's estimate of $100.6 billion.
Read More: J&J (JNJ) Q1 Revenue Surges 10% to $24.1B, Beats Analyst Estimates
S&P 500 Rallies 3.6% Following U.S.-Iran Ceasefire Announcement
The S&P 500 closed up 3.6% week-to-date, driven by a ceasefire announcement between the U.S. and Iran. The Nasdaq Composite and Dow also rallied 4.7% and 3%, respectively, marking their best week since November. President Trump's announcement of a two-week pause on Iranian strikes has alleviated market tensions. However, financial commentator Jim Cramer expressed concerns about market overconfidence and ongoing geopolitical risks, advising caution ahead of upcoming corporate earnings reports, including Goldman Sachs (GS) and Johnson & Johnson (JNJ).
Read More: S&P 500 Rallies 3.6% Following U.S.-Iran Ceasefire AnnouncementMore Health Care stocks
Frequently asked questions
Is Johnson & Johnson in the S&P 500?
Yes. Johnson & Johnson trades as JNJ and is a member of the S&P 500. The index lists it in the Health Care sector.
What sector is JNJ in?
JNJ sits in the Health Care sector of the S&P 500.
Where can I find the latest JNJ news?
Right here. This page collects recent JNJ news and market analysis. Every story gets an AI summary and a bullish, bearish or neutral tag.
What is Johnson & Johnson's stock price?
JNJ last traded at about $253.79. Prices move all through the session, so this is the latest quote rather than a live one.
What is Johnson & Johnson's market cap?
JNJ is worth roughly $611.61B. Market cap is the share price times the number of shares outstanding.
What is JNJ's P/E ratio?
JNJ trades at a trailing P/E ratio of about 38.5. The ratio compares the share price with earnings per share over the past year.