TechnicalAnalysis News & Analysis
10 articles
Market Mood

Dow Jones Index Consolidates Between 200 SMA and 20 SMA Levels
The Dow Jones index is currently trading between its 200-day simple moving average (SMA) and 20-day SMA. This suggests a period of consolidation within these technical levels. No specific price points or percentage changes were provided in the article. This technical setup indicates that the index is neither in a strong uptrend nor downtrend at the moment. The moving averages represent long-term and short-term average prices, with the 200 SMA showing the average over 200 days and the 20 SMA over 20 days. The index's position between these averages reflects uncertainty or balance between buying and selling pressures. No official statements or forecasts were included. For investors, this means the Dow Jones is in a wait-and-see phase without clear directional momentum. The consolidation between these moving averages may lead to a breakout or breakdown depending on future market activity. Monitoring these SMA levels can provide insight into potential moves in the index.
Read More: Dow Jones Index Consolidates Between 200 SMA and 20 SMA Levels
Copper Tests Key Resistance Cluster Amid Bear Flag Pattern
Copper prices are currently testing a significant resistance cluster as part of a bear flag chart pattern. This technical setup indicates a pause or slight retracement within a broader downtrend in the copper market. The live price action shows copper approaching levels where sellers previously weighed in, suggesting that this resistance could halt upward momentum. Traders monitoring copper will watch this cluster closely to determine if the bear flag will resolve with a continuation of the downtrend. This technical behavior is important as copper is a widely used industrial metal, and its price trends can indicate broader economic activity. The resistance test suggests potential challenges for copper prices to gain sustained upward traction in the near term, which could influence investment decisions and commodity-related strategies.
Read More: Copper Tests Key Resistance Cluster Amid Bear Flag Pattern
Hang Seng Index RSI Indicates Oversold Conditions at 23,876
The Hang Seng Index is experiencing oversold conditions, with a Relative Strength Index (RSI) of 27.96 at the level of 23,876. The RSI, a technical indicator measuring the speed and change of price movements, indicates that a level below 30 suggests the asset may be oversold, potentially presenting a buying opportunity. It provides insight into whether stocks are in an overbought or oversold condition. The current level puts the Hang Seng Index in a position that some technical analysts may consider due for a rebound. Oversold conditions don't guarantee a price correction, but they highlight possible undervaluation. Investors often use the RSI as part of a broader strategy, considering other factors before making decisions. For ordinary investors, the current RSI of the Hang Seng Index could suggest a potential opportunity, depending on subsequent market movements and other economic indicators.
Read More: Hang Seng Index RSI Indicates Oversold Conditions at 23,876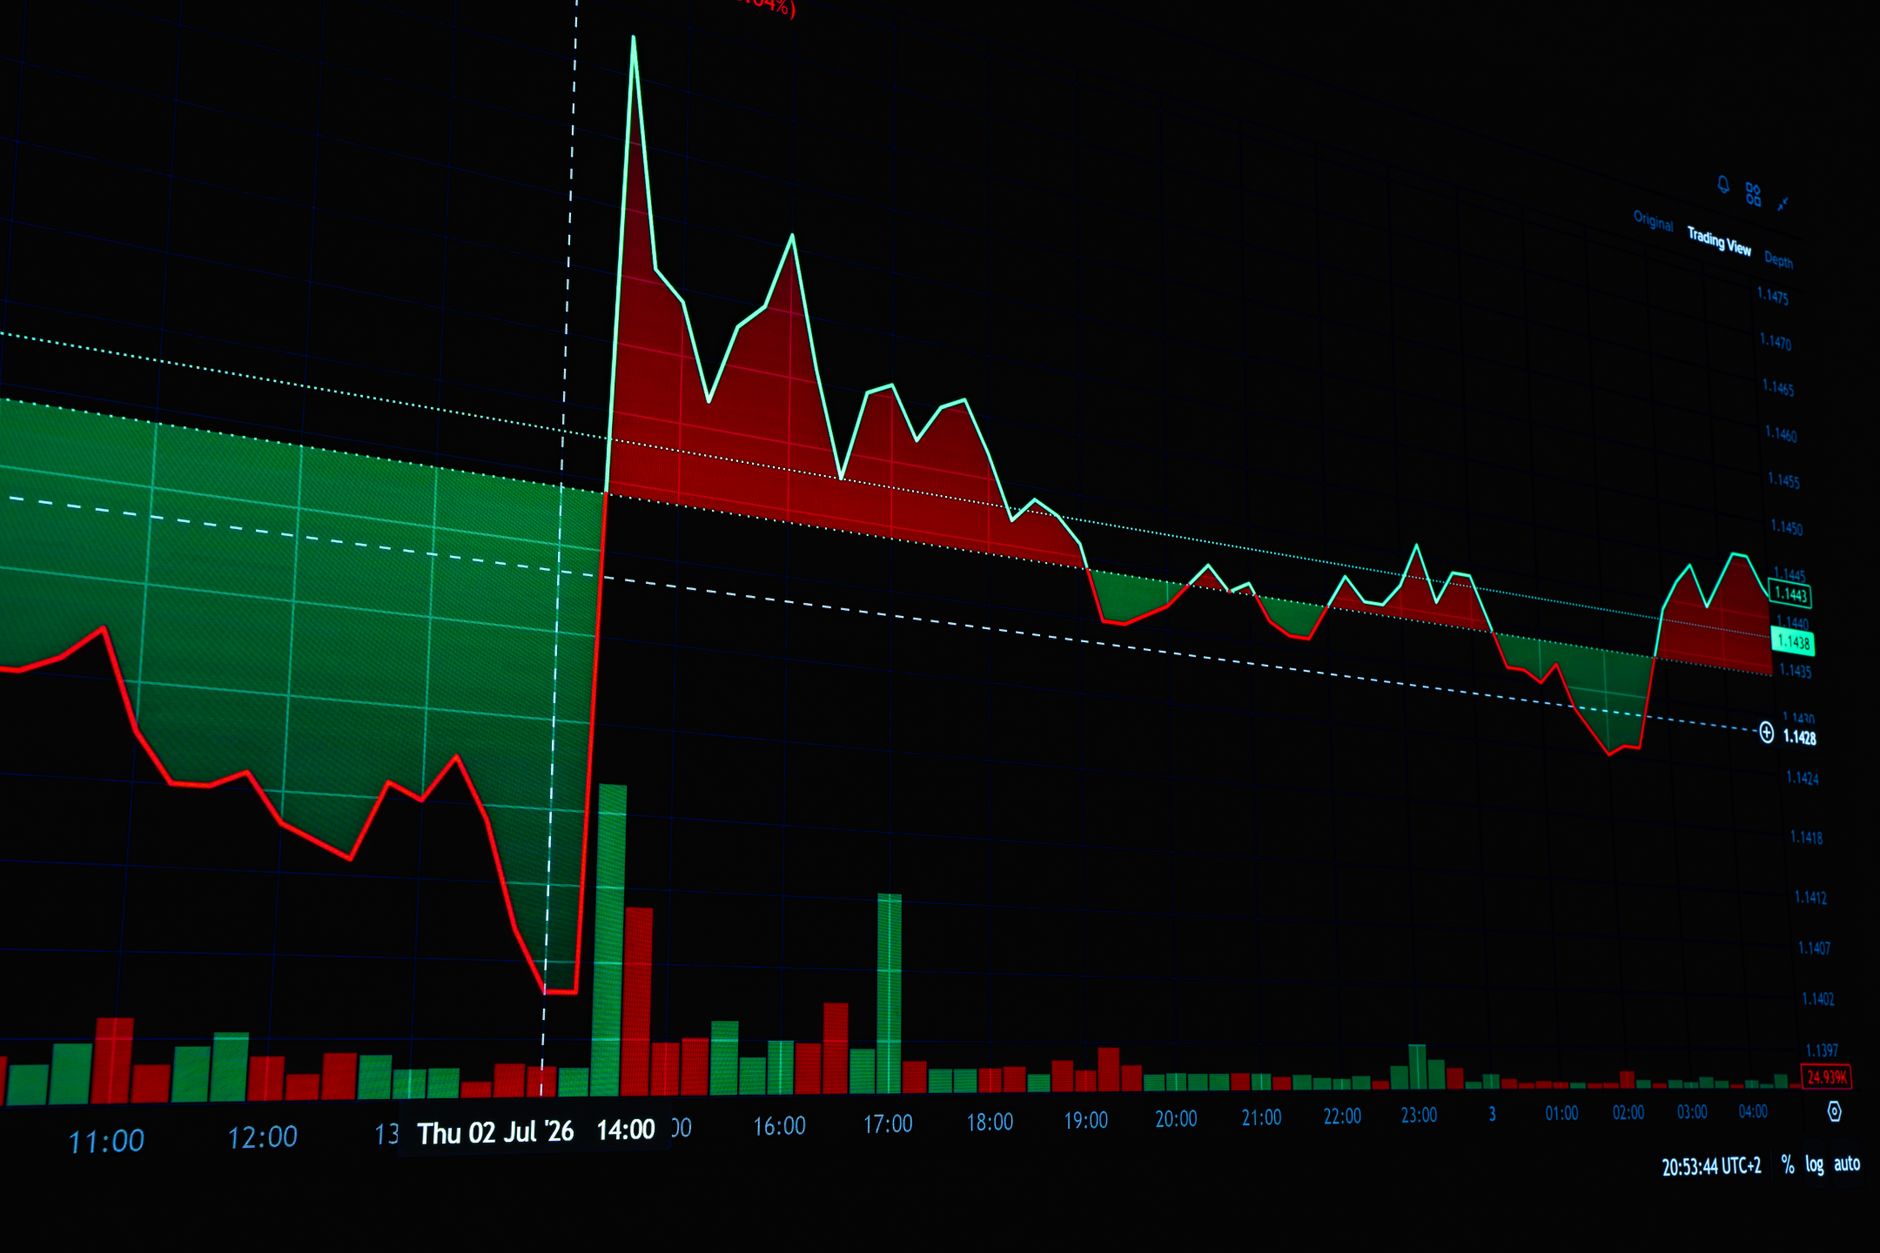
Manulife Financial (TSX:MFC) Moving Average Crossover Analysis
Manulife Financial (TSX:MFC) is experiencing a moving average crossover, a technical indicator that has been noted for potential changes in market direction. This indicator involves the short-term moving average crossing above the long-term moving average, which some analysts consider a bullish sign. The article discusses how such technical movements may lead to increased trading activity. Understanding these price patterns can help investors make informed decisions about entering or exiting positions in Manulife Financial.
Read More: Manulife Financial (TSX:MFC) Moving Average Crossover Analysis
Alphabet C (GOOG) Breaks Ichimoku Cloud Near Fibonacci Resistance
Alphabet C (GOOG) has broken through the Ichimoku cloud, indicating potential bullish momentum. The stock approached Fibonacci resistance levels, reflecting market interest in its price movement. Such technical advancements could influence trading volumes as analysts monitor this break. With these patterns identified, investors might look for opportunities to capitalize on price movements. This matters for ordinary investors as it signals potential shifts in market behavior around Alphabet C's stock.
Read More: Alphabet C (GOOG) Breaks Ichimoku Cloud Near Fibonacci Resistance
Tesla (TSLA) Bull Flag Analysis Nears Resolution at $359
Tesla (TSLA) is currently trading at $359 with a bull flag pattern indicating a potential price movement. The market is observing how this pattern resolves, which could significantly impact trading strategies for investors. The bull flag is a common continuation pattern, suggesting that if it breaks out upwards, it could lead to further gains. Monitoring this development is crucial for investors looking for entry points in Tesla's stock.
Read More: Tesla (TSLA) Bull Flag Analysis Nears Resolution at $359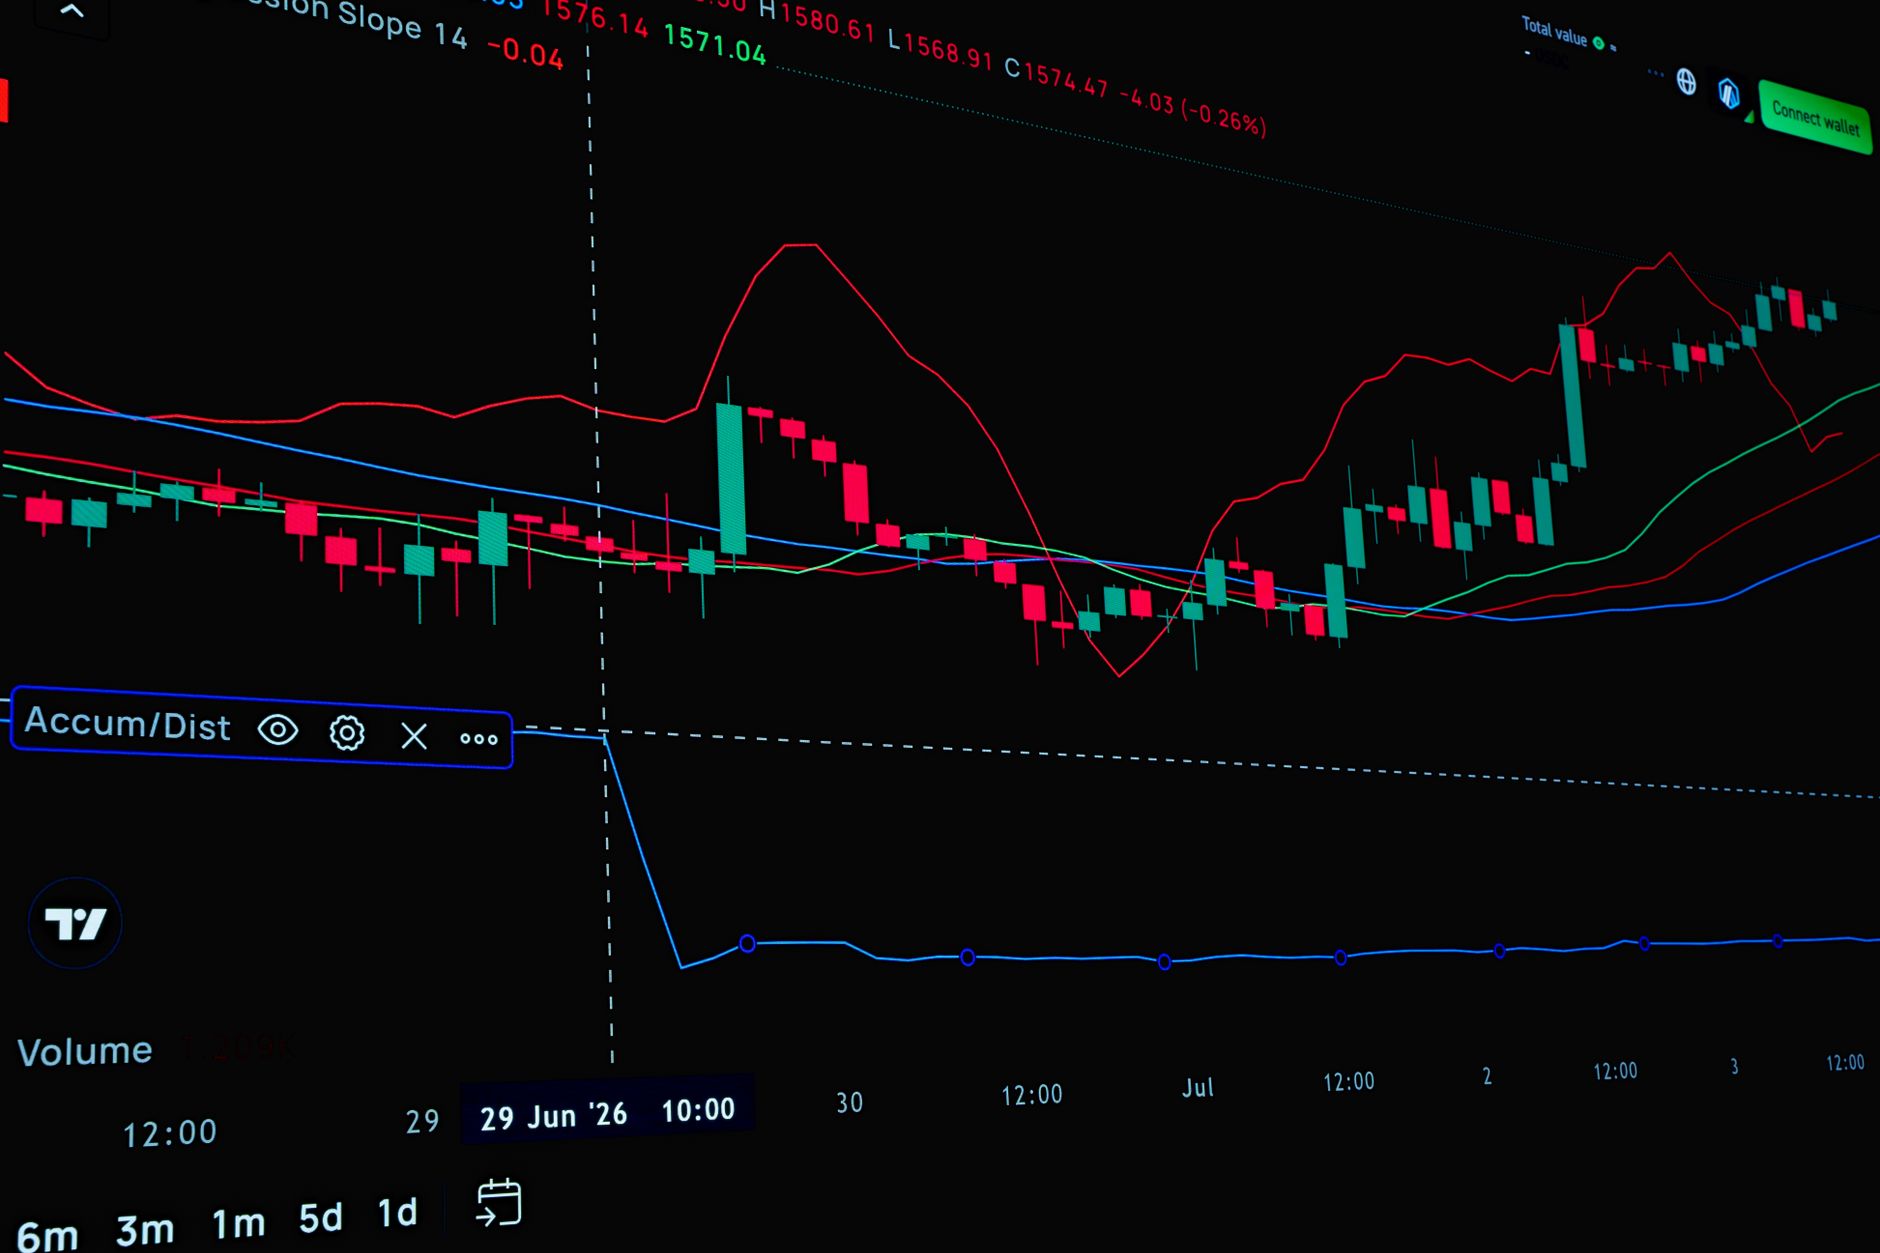
Mullen Group (TSX:MTL) Surpasses Key Trading Average Level
Mullen Group (TSX:MTL) has moved above its key trading average, indicating a possible shift in market sentiment. This movement could suggest increased buying interest as shares trade above this significant technical indicator. The crossing of key averages often influences investment decisions and market behavior. For investors, understanding these trends is crucial as they can signal potential opportunities or risks in stock performance.
Read More: Mullen Group (TSX:MTL) Surpasses Key Trading Average Level
Tesla (TSLA) Faces Bearish Engulfing at $341 Resistance Level
Tesla (TSLA) is currently showing a bearish engulfing pattern at the $341 resistance level. This technical analysis suggests potential downward movement in the stock price. The stock's performance at this level is critical for traders and investors as it may indicate sentiment shifts. Monitoring these levels can help investors understand market trends and potential volatility in Tesla's stock.
Read More: Tesla (TSLA) Faces Bearish Engulfing at $341 Resistance Level
Gold Prices Break Key Trend Line Amid Iran Conflict Impact
On Friday, gold prices rose above a significant short-term technical level, indicating a potential recovery in momentum. This event follows a period of sluggish performance attributed to the ongoing Iran conflict. Traders are watching for further gains as market sentiment shifts. Observing these trends is crucial for investors in commodities, particularly gold.
Read More: Gold Prices Break Key Trend Line Amid Iran Conflict Impact
S&P 500 Breaks Major Support: Analysts Predict 10% Further Decline
The S&P 500 has recently breached a significant support level, raising concerns among investors about a possible additional decline of 10%. Technical analysis suggests that this is an optimal moment for investors to reassess their risk exposure in the equity markets. The potential downturn could have wide-ranging implications for investor sentiment and market stability. Analysts are closely monitoring key levels as market dynamics evolve.
Read More: S&P 500 Breaks Major Support: Analysts Predict 10% Further Decline